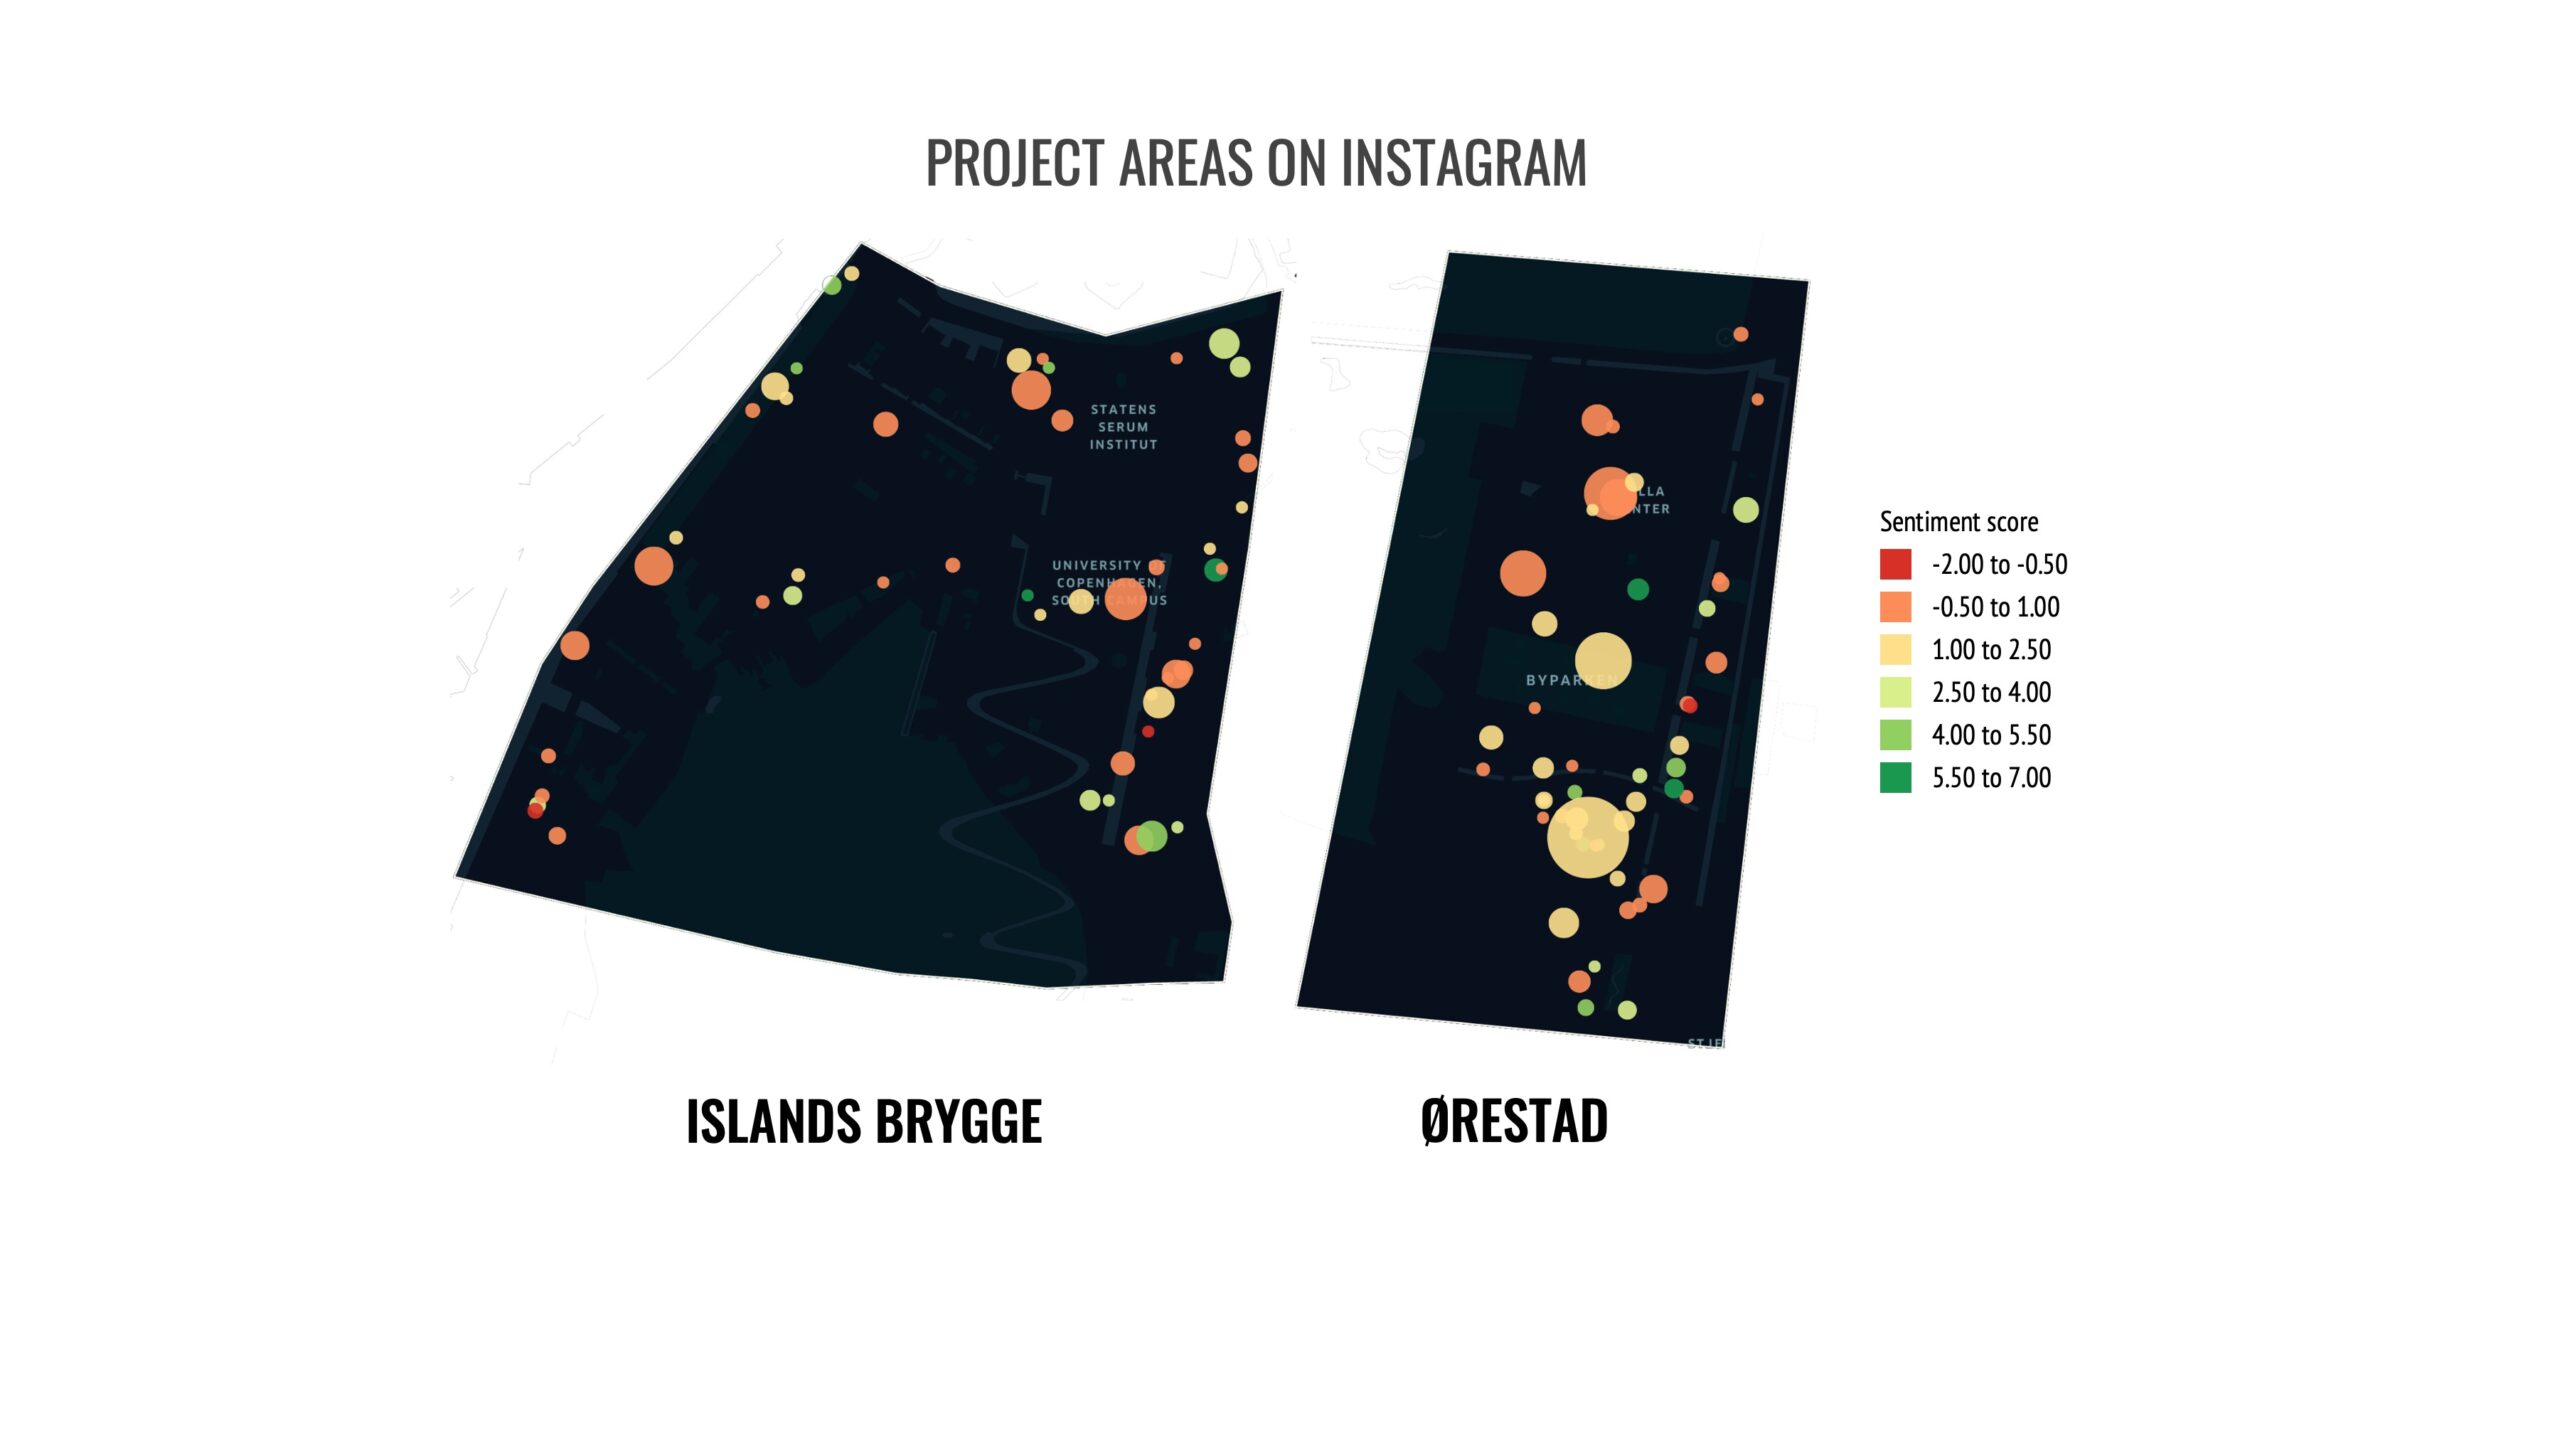
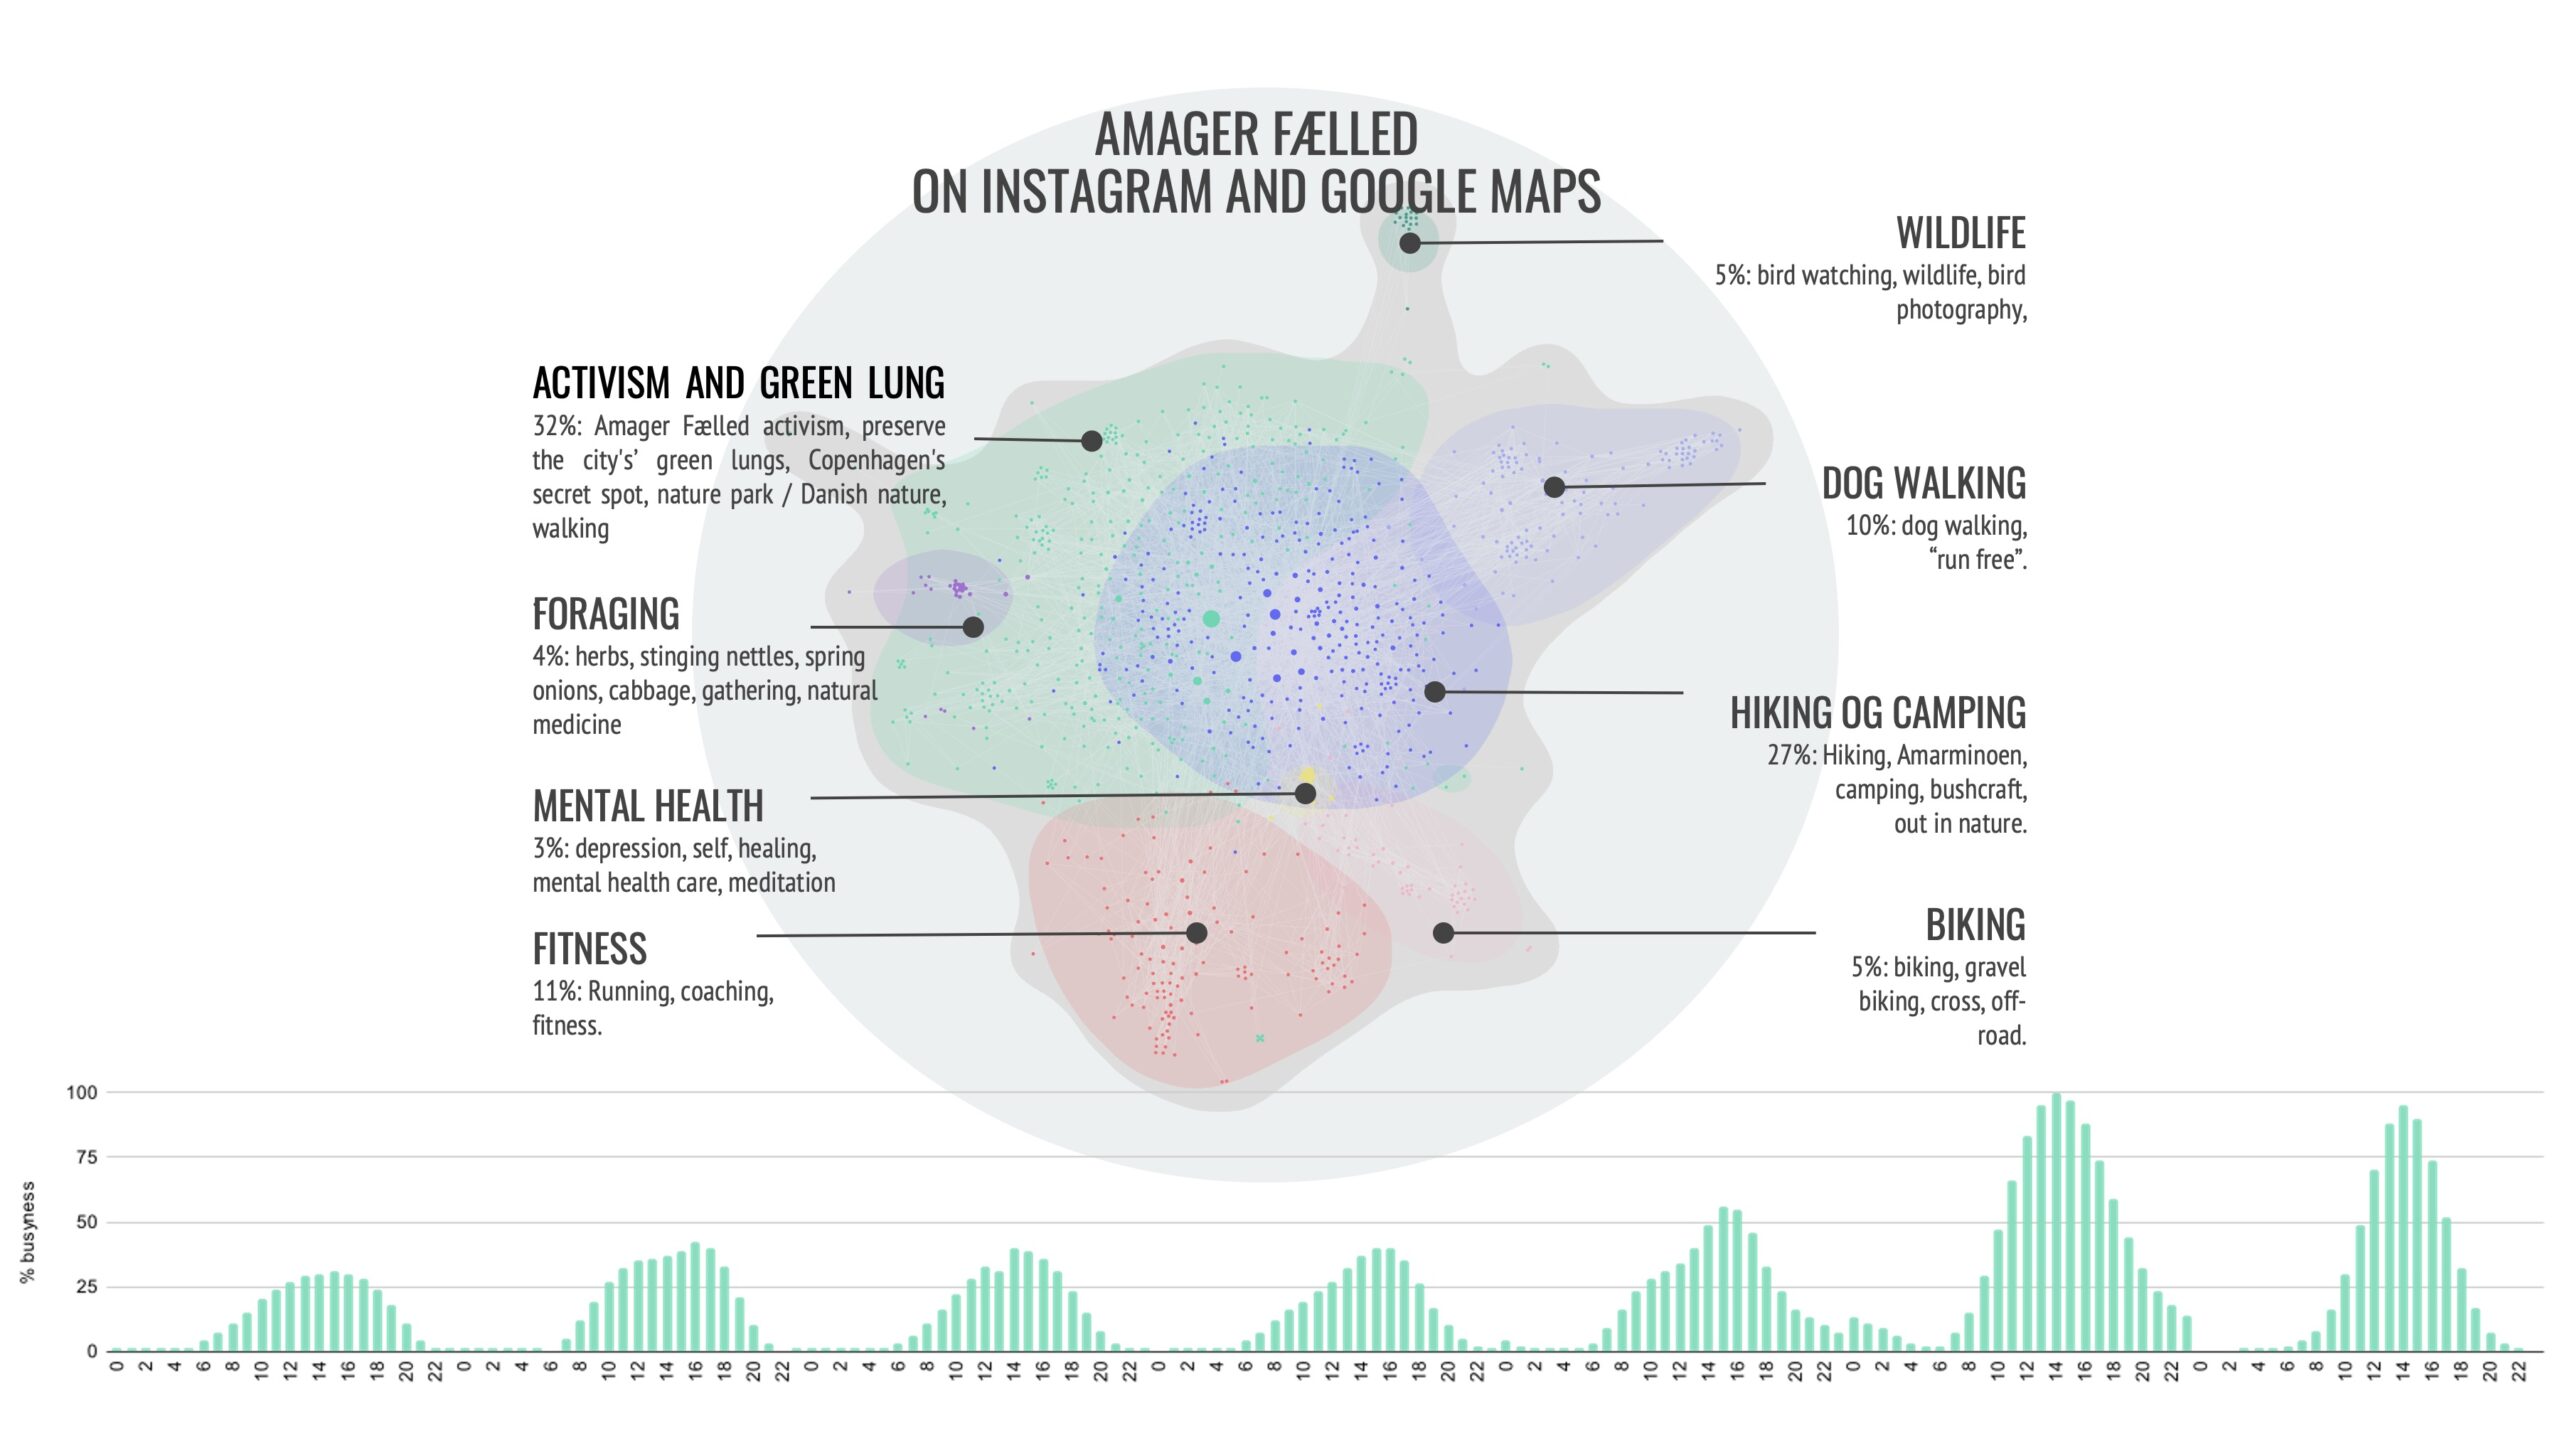
From December 2020 to February 2021 data from instagram posts from all locations in the project areas have been analaysed using co-hashtag network analysis (i.e. hashtags that are often used in the same posts or ‘cluster together’) and sentiment analysis of post captions. Instagram posts is a metric for where social activity tends to concentrate. The nature of Instagram is that the data we get, represents the kinds of things people would like to share through a photo. In a way, these data provide a picture of where things, that people see as meaningful in the public, tend to converge.
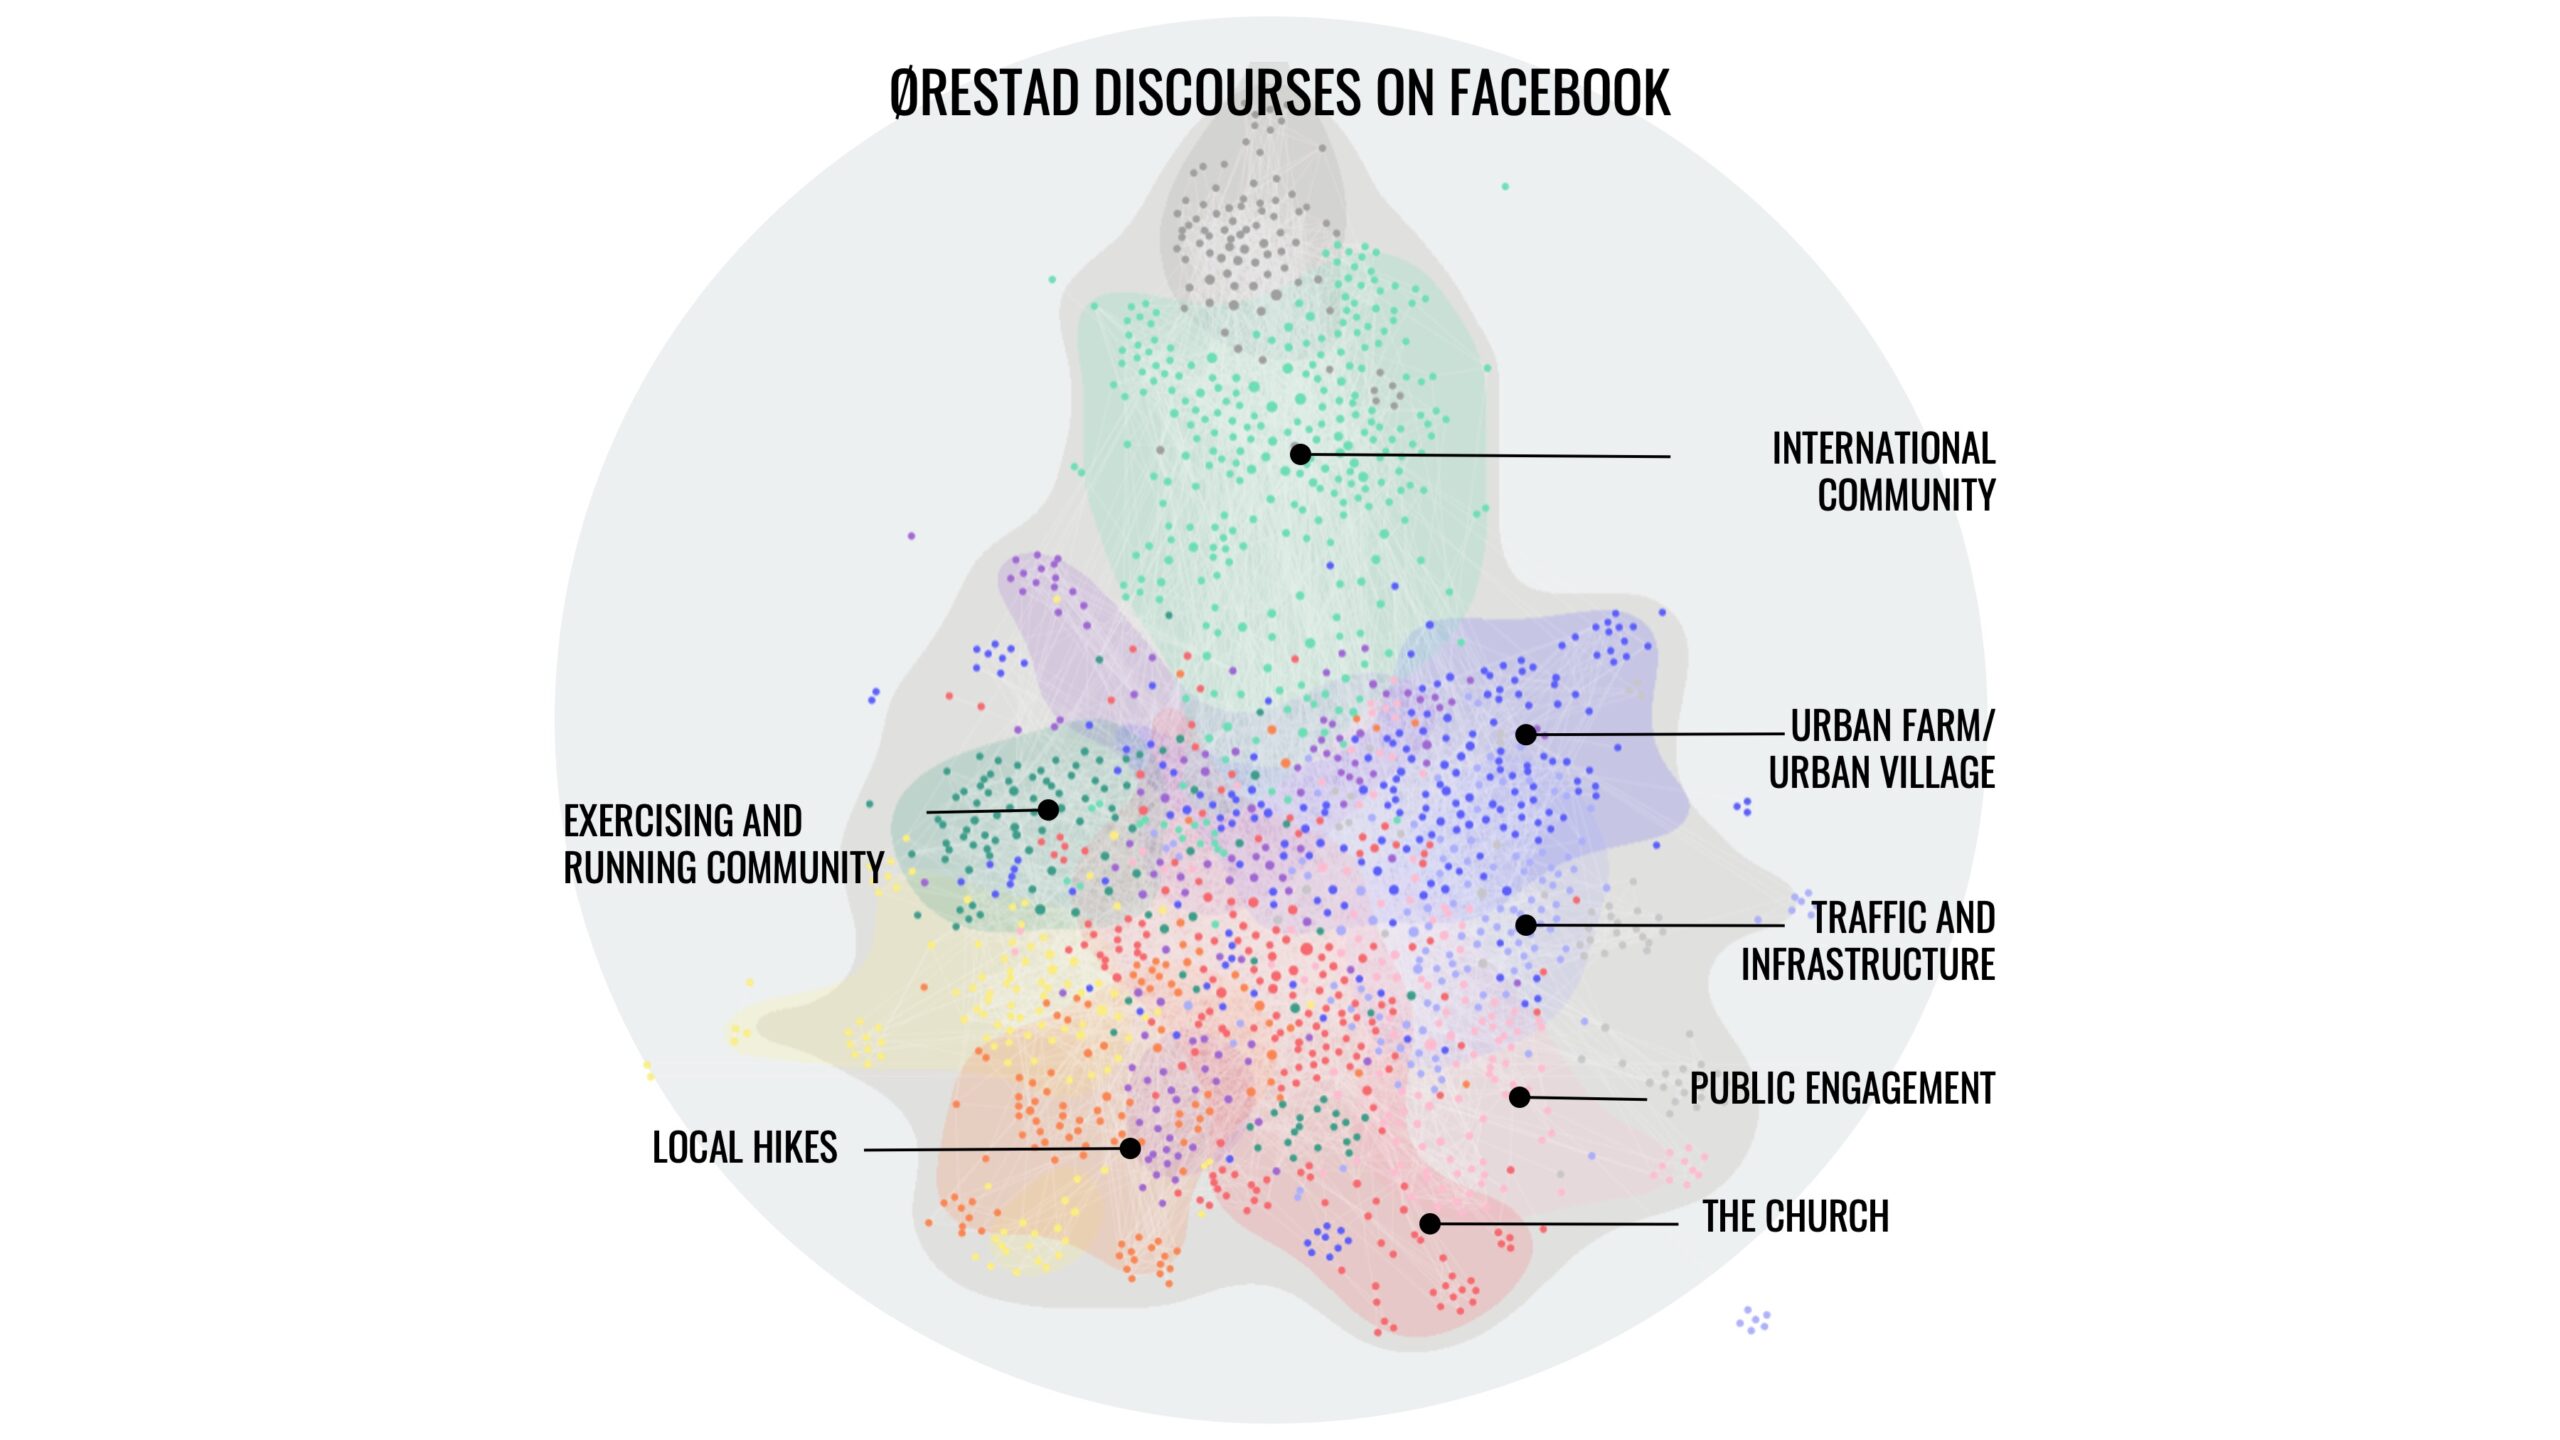
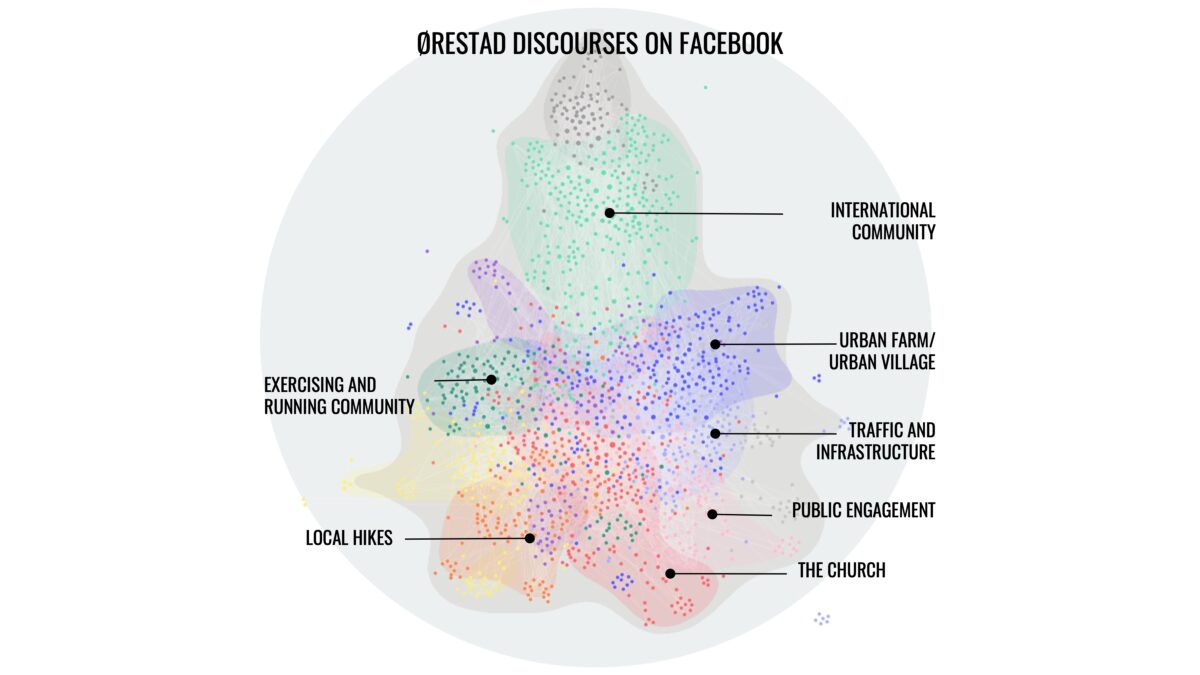
Data was collected from posts in the publicly open Facebook groups ‘Ørestad’ and ‘Det sker i Ørestad’ by the use of terms extraction (i.e. all noun phrases appearing in the posts minimum twice) and semantic network analysis (i.e. terms that often appear in the same posts or ‘cluster together’). Understanding the public discourse of Ørestad supported the ability to chose and design interventions which aligned with the existing identity and experiential layer of the area on Amager.
Google Maps API
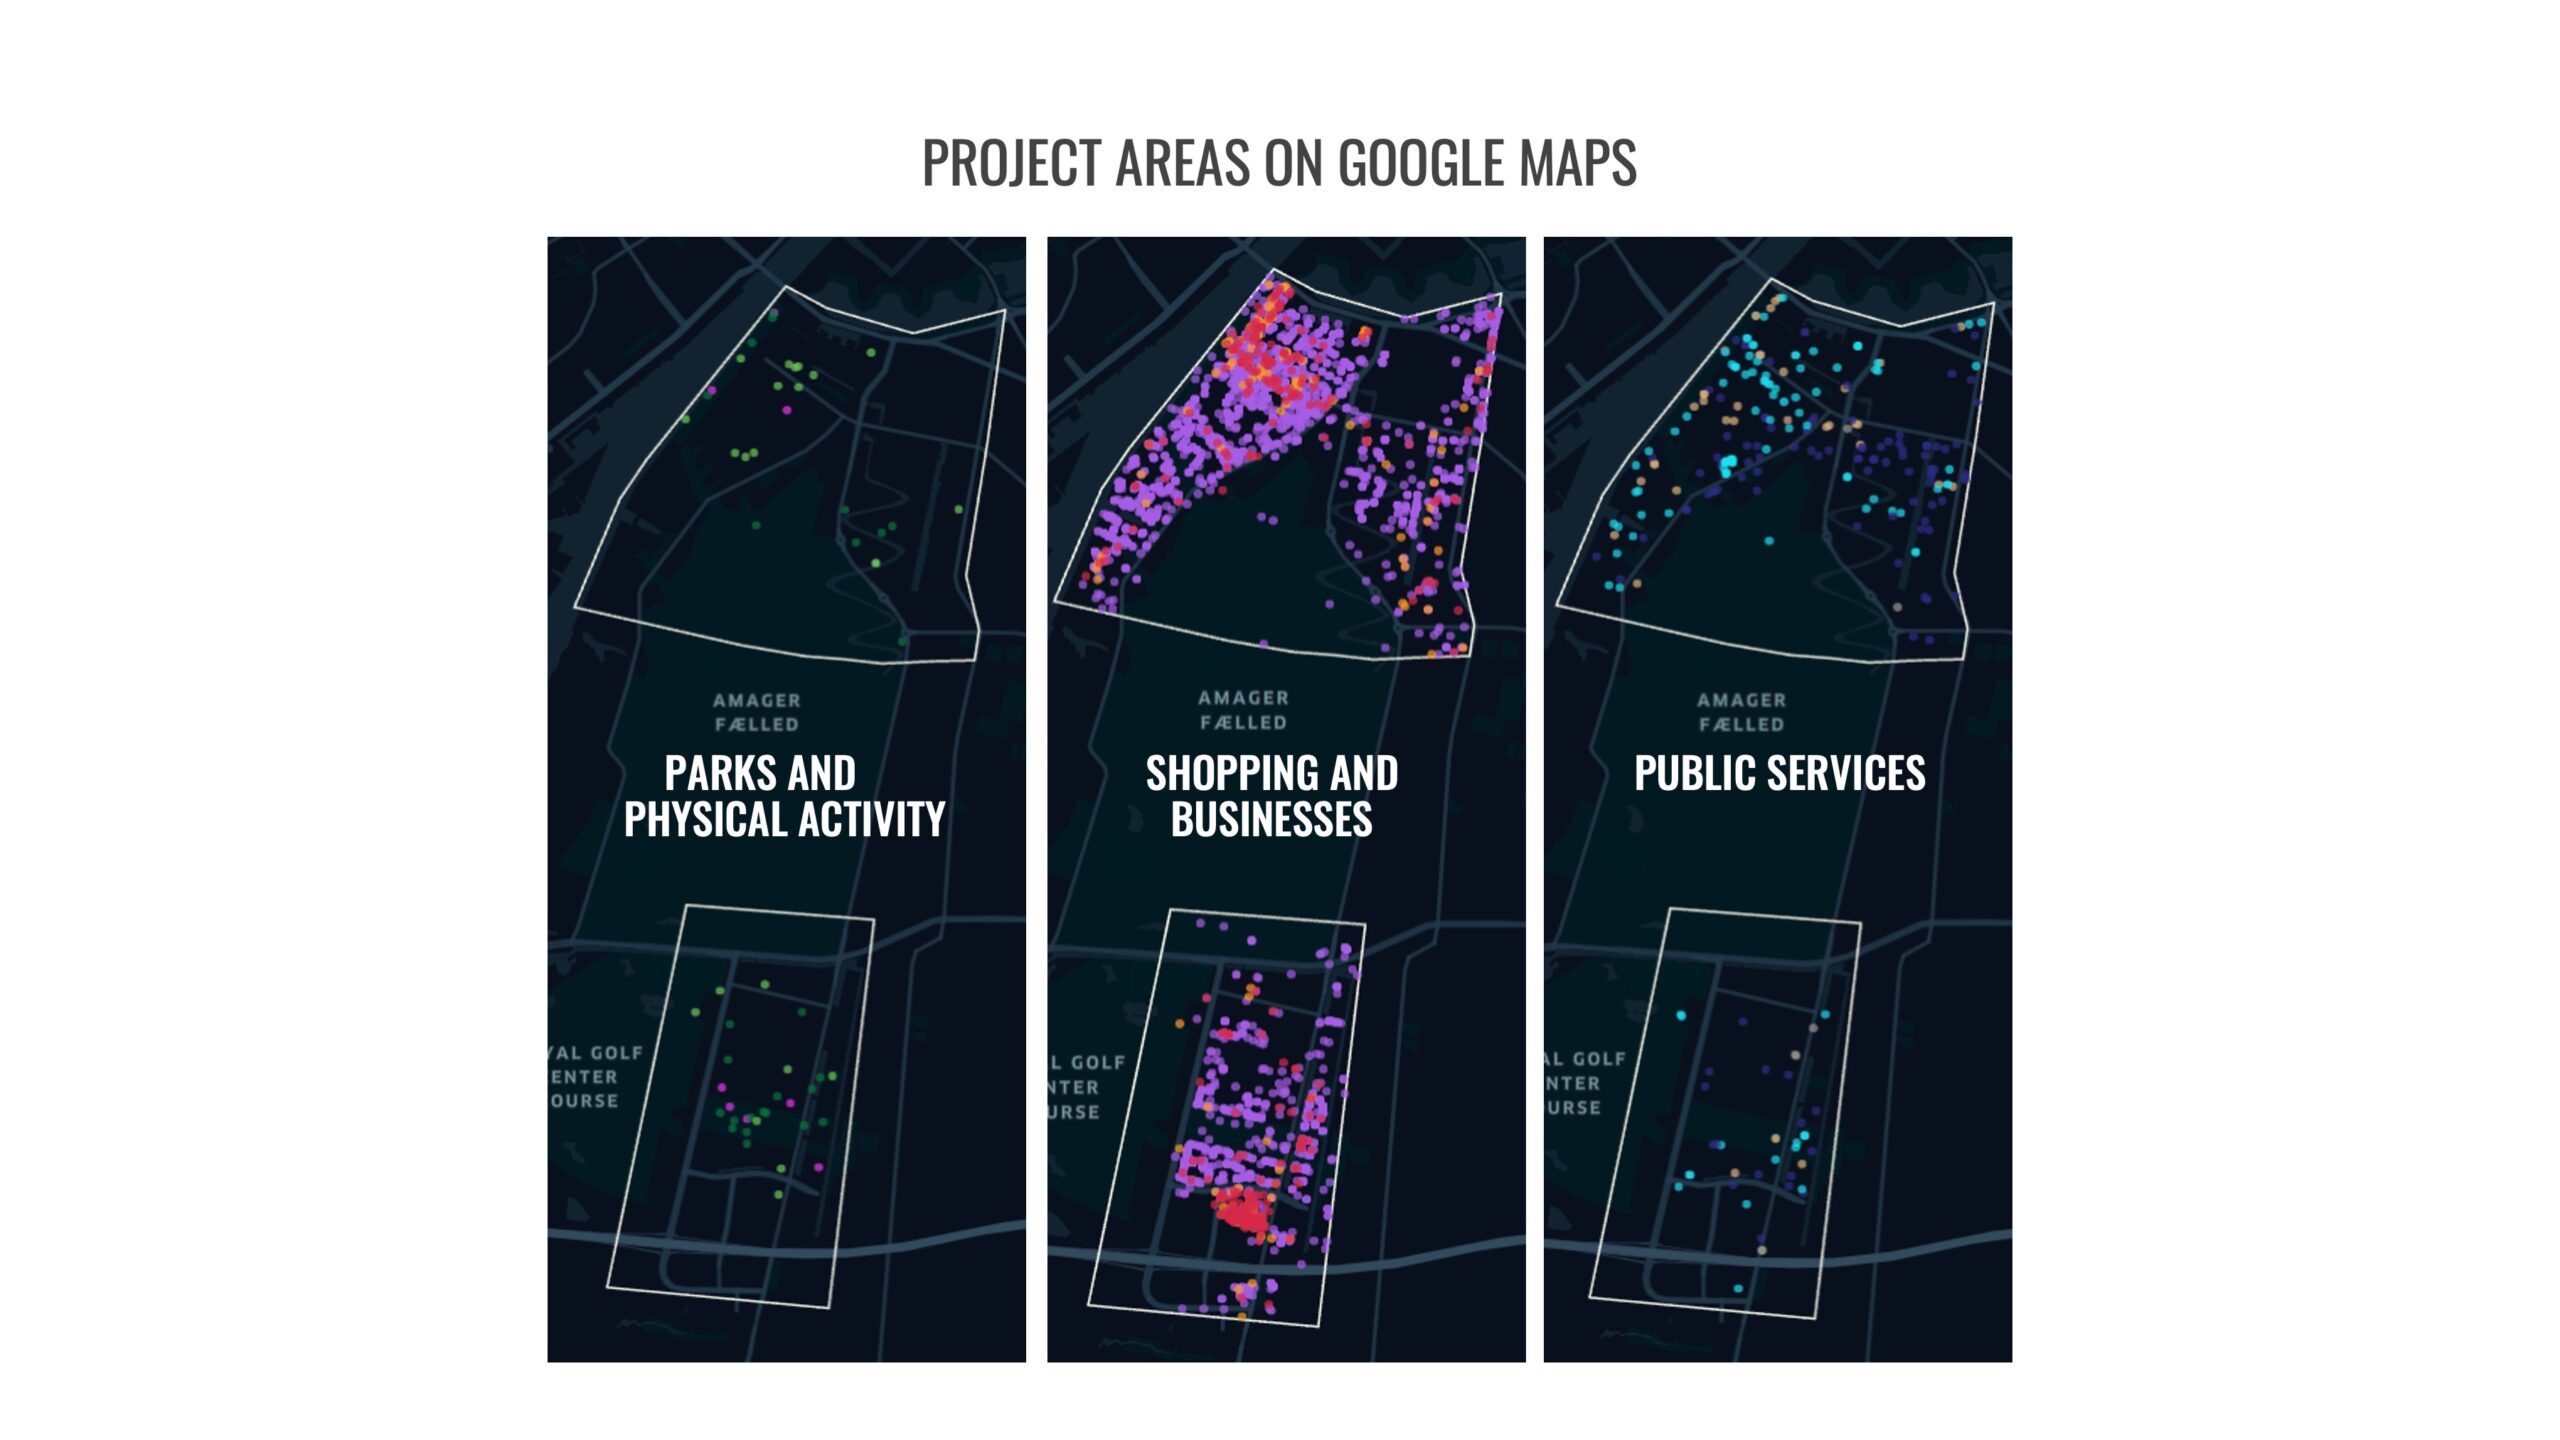
The graphic illustrates all the Google places in the project area, including their category – a total of 4400 unique locations. These data give an indication of the ways spaces are used in the different parts of the project area, which provides a tool to quickly understand the physical surroundings of concern. Basically, what kind of urban life is dominating in the different parts of Islands Brygge and Ørestad. Data has been collected by the use of Geo mapping.
Data analysis
The public can be engaged either actively by requesting input on how an area is used or perceived or indirectly by looking into the digital traces left by those who use the area to understand their experience of the area. The latter has been the focus of these aforementioned analyses. We have used Google Places to provide an overview of the use of urban space, Instagram location post to get a feel for how activity and engagement is dispersed and Facebook group posts to understand the public discourse surrounding the area of concern.
Together, these sub-analyses give a digital view of public life in the two areas, Ørestad and Islands Brygge, to support the selection and planning of the physical pilot interventions in the Thrive Zone Amager project.